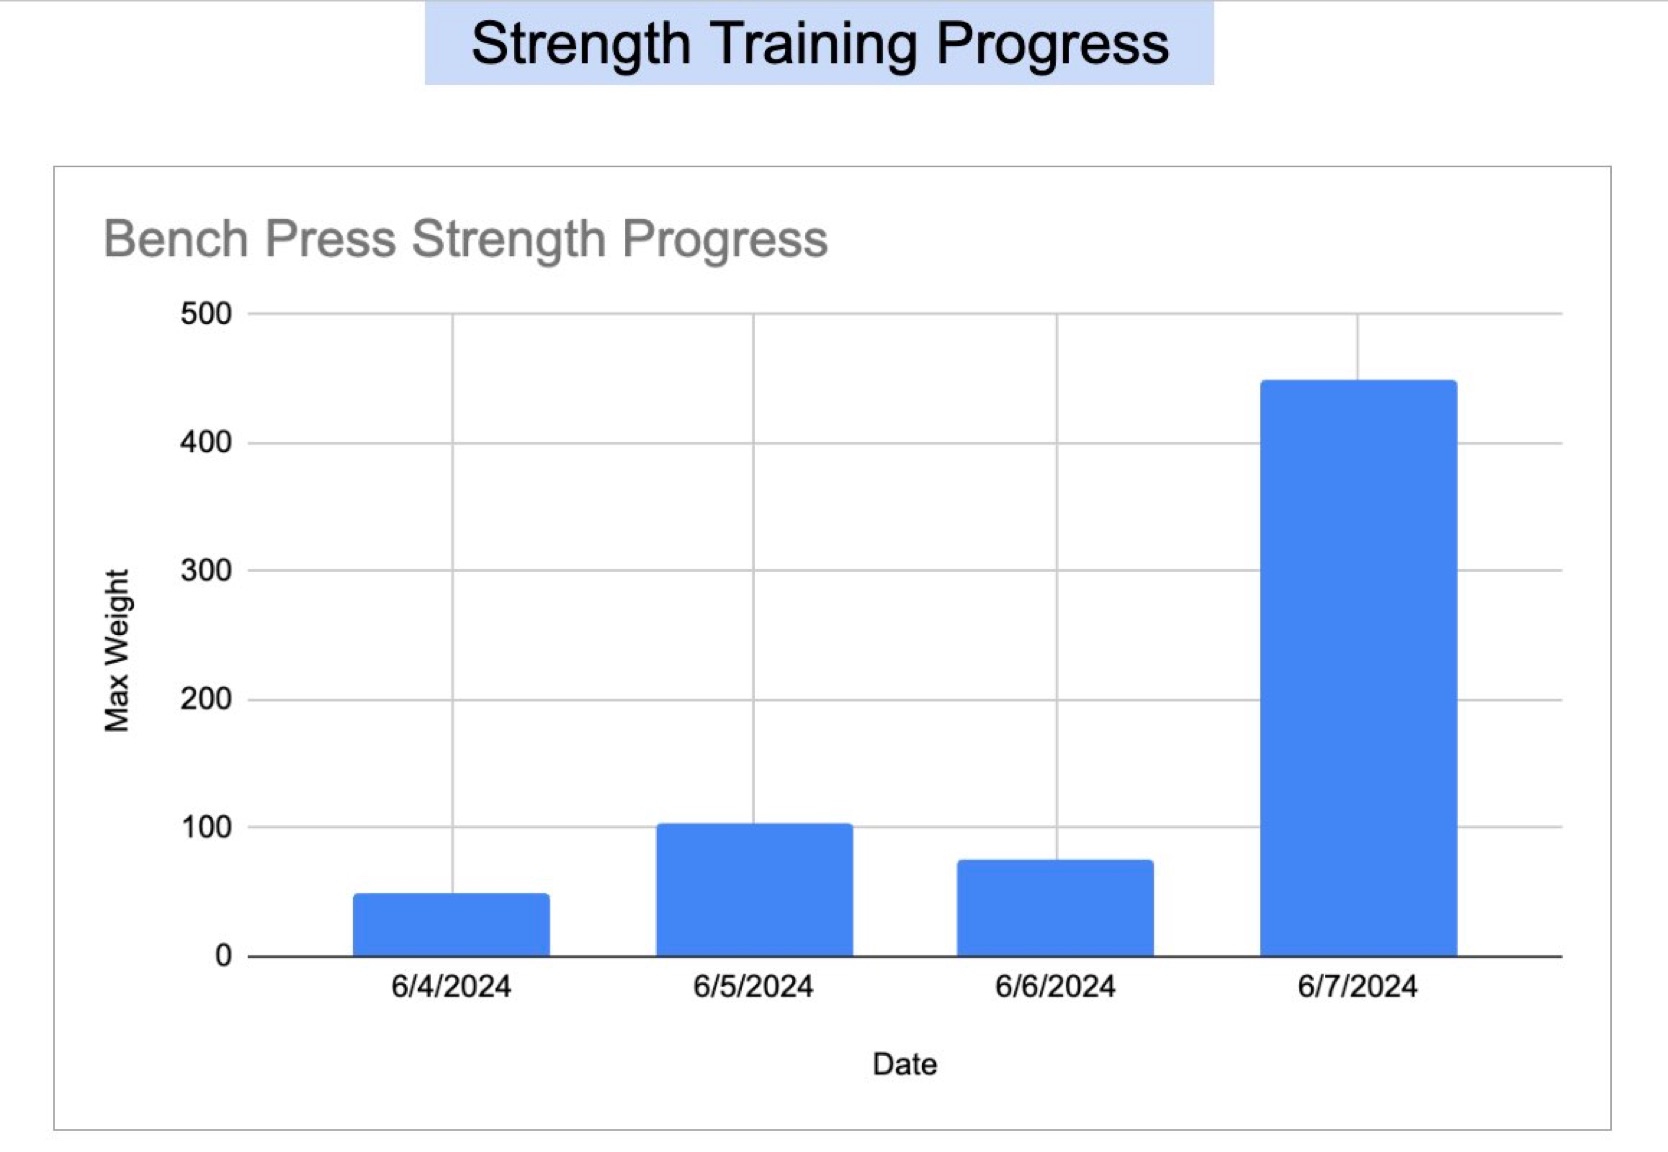
Creating a Dashboard
This is an overview of how to create a dashboard to present data in Google Sheets
- On the bottom of the Exercise Tracker Sheet, rename "Sheet1" to "Dashboard"
- Create a header for the chart on the sheet titled "Dashboard":
- Merge cells D1:F1
- Title the selection as "Strength Training Progress"
- Center the text vertically and horizontally
- Change the font size to 17 and bold the text
- Set the background color of the selection to light blue
- Under the "View" tab, locate "Show" and deselect "Gridlines"
- Select columns Date and Max Weight on the "Form Responses 1" sheet by using cmd + left click
- Under the Insert tab, select Chart
- Under the Chart Editor select Column Chart
- Double-click on the chart title and rename the chart "Bench Press Strength Progress"
- Copy the chart and paste it in the "Dashboard" sheet, underneath the header
- Note: This process can be repeated for any exercise or criteria for progress that is desired.